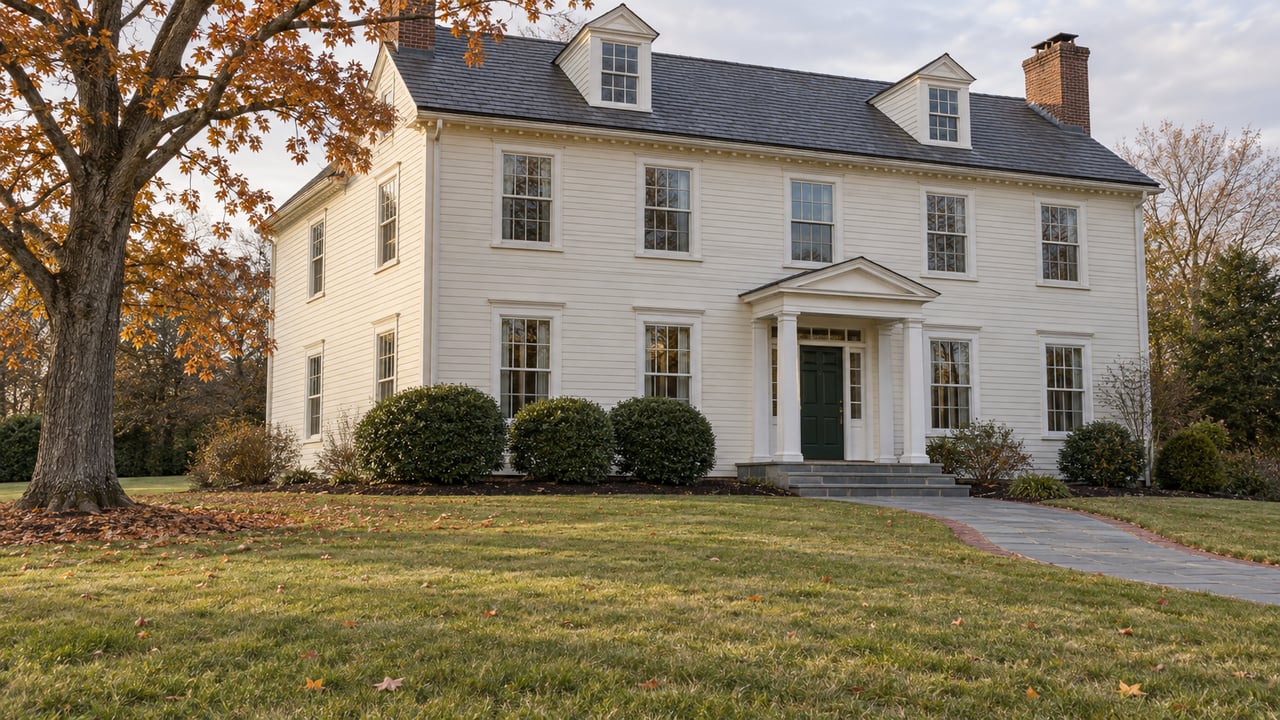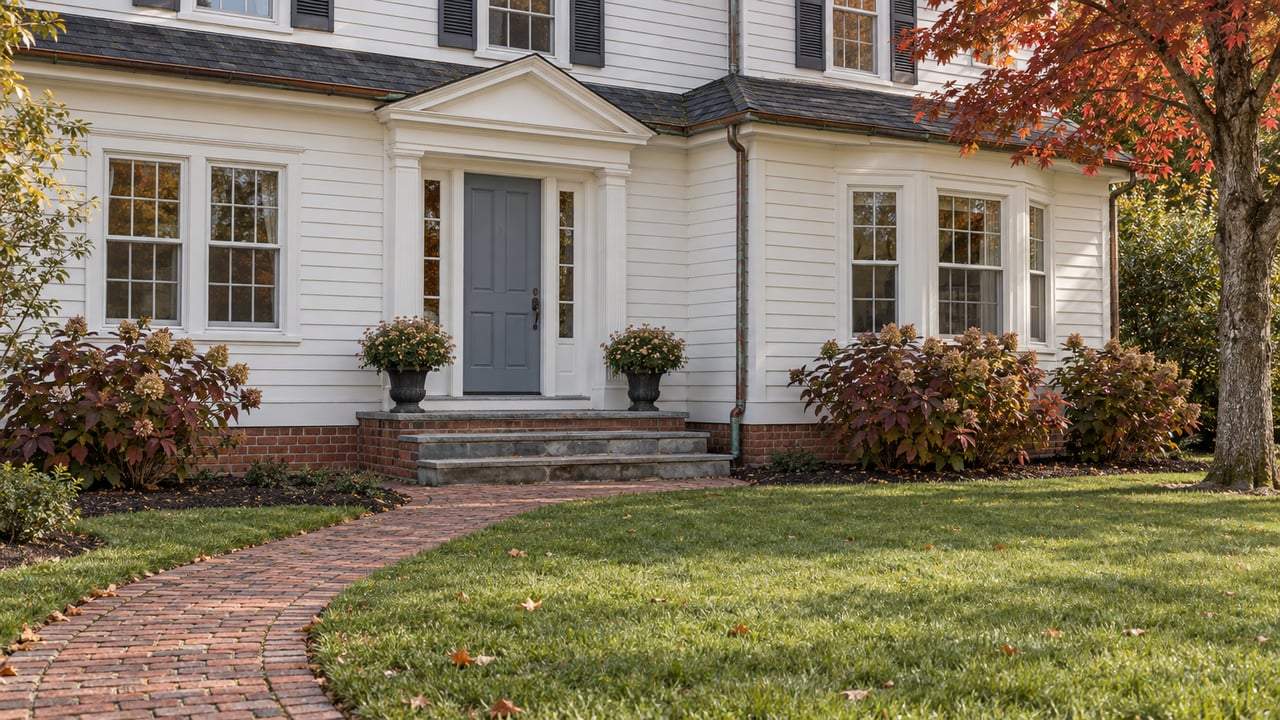
Two Manalapan houses closed on Sept. 9, 2026. The first was 17 Eliot Road, a three-bedroom home built in 1970 with 1,640 square feet, which sold for $810,000. The second was 48 Alexandria Drive, a five-bedroom house built in 1981 with 3,071 square feet, which sold for $1,125,000. Both appeared in the same NJ.com roundup of Manalapan sales for title recordings between Sept. 28 and Oct. 11.
The Alexandria Drive buyer got 1,431 more square feet for $315,000 more. That works out to about $220 for each added foot. The Eliot Road house sold at $494 per square foot and the Alexandria Drive house at $366.
The rest of Manalapan's recent sales follow the same pattern. The first 1,600 or 1,700 square feet of a Manalapan house carry most of the price. Each foot after that costs much less. A buyer comparing homes on price per square foot will think the large 1980s houses are cheap and the 1960s houses are expensive, when what the gap really measures is how little the township's market charges for added space.
The Average Hides Two Different Prices
From the July 27 to Aug. 9 edition through the Nov. 2 to 8 edition, NJ.com's weekly Manalapan roundups put the average price per square foot between $326 and $380 for the sales recorded each week. A buyer who treats that range as the going rate will misprice nearly every house they tour, because Manalapan's housing stock splits into two groups that sell at different per-foot prices.
The first group was built from the mid-1960s to the early 1970s, and recent sales include houses on Kilmer Drive, Eliot Road, Whittier Drive, Kipling Way, Hillcrest Road and Blenheim Road. The houses are mostly three and four bedrooms with roughly 1,500 to 2,500 square feet. These are recent sales from the roundups:
| Address | Built | Sq ft | Price | Per sq ft | Closed |
|---|---|---|---|---|---|
| 6 Hillcrest Road | 1971 | 1,527 | $755,000 | $494 | Oct. 9 |
| 17 Eliot Road | 1970 | 1,640 | $810,000 | $494 | Sept. 9 |
| 1 Blenheim Road | 1968 | 1,543 | $700,000 | $454 | June 18 |
| 7 Kilmer Drive | 1967 | 1,736 | $740,000 | $426 | Aug. 28 |
| 19 Whittier Drive | 1967 | 1,700 | $722,500 | $425 | Oct. 16 |
| 37 Gordons Corner Road | 1966 | 1,850 | $745,000 | $403 | Sept. 15 |
| 24 Eliot Road | 1970 | 1,960 | $775,000 | $395 | Sept. 1 |
| 5 Hillcrest Road | 1971 | 2,015 | $789,900 | $392 | Oct. 13 |
| 14 Kilmer Drive | 1967 | 2,251 | $840,000 | $373 | Oct. 2 |
| 44 Kipling Way | 1967 | 2,460 | $875,000 | $356 | Sept. 1 |
The table is sorted by price per square foot. The three highest rates all went to houses of roughly 1,500 to 1,650 square feet, and the three lowest went to houses of 2,000 square feet or more. Within this one era, the smallest homes sold at the highest rate per foot. The whole group sold between $700,000 and $875,000, a $175,000 spread, while living area ran from about 1,500 square feet to nearly 2,500.
What the Larger 1980s House Buys
The second group is the larger single-family house built in the 1980s, on streets such as Thomas Drive, Ivanhoe Drive, Alexandria Drive and Micki Terrace. These houses usually have four or five bedrooms and 2,800 to 3,800 square feet.
| Address | Built | Sq ft | Price | Per sq ft | Closed |
|---|---|---|---|---|---|
| 9 Manor Court | 1986 | 3,435 | $1,060,000 | $309 | Aug. 27 |
| 2 Micki Terrace | 1981 | 2,838 | $880,000 | $310 | Sept. 23 |
| 46 Thomas Drive | 1984 | 3,272 | $1,047,500 | $320 | Oct. 15 |
| 35 Ivanhoe Drive | 1983 | 3,336 | $1,100,000 | $330 | Sept. 22 |
| 41 Thomas Drive | 1984 | 3,791 | $1,325,000 | $350 | Aug. 25 |
| 8 Glendale Drive | 1980 | 3,450 | $1,250,000 | $362 | Aug. 7 |
| 48 Alexandria Drive | 1981 | 3,071 | $1,125,000 | $366 | Sept. 9 |
| 17 Thomas Drive | 1983 | 3,335 | $1,358,000 | $407 | Sept. 28 |
Most of these sold for $310 to $366 a foot, well below the older group. 17 Thomas Drive, at $407, is the one clear exception, and three Thomas Drive sales over two months show that houses of similar size on the same street can close more than $300,000 apart. Each house still has its own condition, lot and updates to price.
The Price of the Extra Rooms
The marginal cost is easiest to see when sales are paired from the same roundup, so the timing matches. The Nov. 2 to 8 edition gives two clean pairs. 19 Whittier Drive, 1,700 square feet, sold for $722,500. 46 Thomas Drive, 3,272 square feet, sold for $1,047,500. The added 1,572 feet cost $325,000, or about $207 a foot. In the same edition, 6 Hillcrest Road sold at 1,527 square feet for $755,000, and 7 Devon Drive, a 1975 house with 2,814 square feet and five bedrooms, sold for $940,000. Those added 1,287 feet cost $185,000, about $144 a foot. That week's average for all 14 recorded sales was $340 per square foot.
Pairs that span a few weeks land in the same range. 7 Kilmer Drive, which closed Aug. 28, against 46 Thomas Drive, which closed Oct. 15, puts the extra 1,536 square feet at about $200 a foot.
The economics follow. The bigger part of a Manalapan purchase price buys entry: a detached house on a lot inside the township. Square footage above that baseline is priced like an add-on. A family that needs a fifth bedroom pays far less for it, per foot, than the averages suggest. A family that needs only three bedrooms and a modest footprint pays the full entry price for less house, which is why the per-foot figure on a 1,600-square-foot house looks so high.
This changes how to read a listing. On a large 1980s house, a price per square foot under the township average is normal for its size, and it does not mean the house is a bargain. On a smaller 1960s house, a per-foot figure in the mid-$400s is in line with recent sales, and it does not mean the house is overpriced. The useful comparison is what the next 1,000 square feet would cost on a different street.
Where the Address Shows Up Instead
Price per square foot does rise with location even when size stays the same, and the clearest case in this period is Lafayette Mills Road. 39 Lafayette Mills Road, built in 1985 with 2,833 square feet, sold for $1,400,000, or $494 a foot, on Aug. 4. Its neighbor at 41 Lafayette Mills Road, built in 1997 with 3,167 square feet, sold for $1,600,000, or $505 a foot, on Aug. 13. These two sales from the Aug. 24 to 30 roundup are among the highest per-foot figures of the period, on houses the same size as the Thomas Drive houses.
The same roundup shows the size effect at its far end. 6 Lamb Lane, built in 2008 with 8,687 square feet and seven bedrooms, sold for $2,750,000 on Aug. 13. That is the highest price on the list and $317 a foot, below most of the 1960s houses. At the top of the market, 21 Appaloosa Drive, a 1999 house with 4,689 square feet and five bedrooms, sold for $2,150,000, or $459 a foot, on Oct. 5. Two houses of similar luxury standing landed $142 apart per foot. The difference between them came from the land, the setting and the finish, and square footage did little to explain it.
Marlboro Prices the Same Way
Marlboro, next door, shows the same structure at a higher price level. For the week of Aug. 24 to 30, NJ.com's Marlboro roundup counted 55 recorded sales averaging $954,677 and $358 per square foot. The Manalapan roundup for the same week counted 79 sales averaging $740,728 and $339 per square foot. Marlboro's average price was about 29 percent higher, and its average per-foot price only about 6 percent higher, so most of the gap between the two towns that week came from the homes sold rather than from what a foot of space cost. Marlboro's list also had a 1968 house at 9 Fairview Road, 2,586 square feet, that sold for $1,350,000, or $522 a foot, the same small-older-house premium on a different street.
For buyers weighing the two townships, it helps to compare the per-foot price of homes of similar age and size across the line. Comparing town averages mixes together different housing stock.
The County Backdrop
The broader market is firm. NJ REALTORS® figures for October 2026 put the Monmouth County single-family median at $844,450, up 7.7 percent from October 2025, with 3.0 months of supply, 35 days on market and sellers receiving 100.7 percent of list price on average. Those are countywide numbers. In a market where homes sell at or above asking within about five weeks, buyers have little room to bargain on any one house. That makes it more useful to know what added space costs before choosing which kind of house to pursue.
FAQ
Why do some closing dates fall weeks before the roundup's dates? NJ.com groups sales by the week the title was recorded, and the sale itself may have closed earlier. That is why a roundup labeled Nov. 2 to 8 lists closings from Oct. 8 to Oct. 16.
Do these roundups show every Manalapan sale? Each edition lists up to the ten most expensive sales recorded that week, along with the count and averages for all recorded sales. The individual addresses here lean toward the upper part of the market, and the weekly averages cover the full set.
Is a high price per square foot a warning sign on a smaller house? Recent sales of 1960s and early 1970s Manalapan homes under 2,000 square feet mostly closed between about $395 and $494 a foot, from June through October 2026. A figure in that range matches the market for that kind of house.
If you are deciding between a smaller older home and a larger 1980s home in Manalapan, our advisors can price both against the street-level sales behind these numbers, so you know what the added space is worth before you make an offer. Schedule a free consultation with Critelli Realtors®, or begin with our Manalapan neighborhood guide.